Exploratory Data Analysis using SweetViz

Software developer | Freelance Content Creator
Exploratory Data Analysis is an essential process in data science using which you will understand the features of a dataset. Normally, we use standard python libraries like Pandas, Numpy, Matplotlib, and Seaborn to analyze and visualize the dataset to understand it better.
Recently, I came across an Open-source library SweetViz which automates this exploratory data analysis process in a couple of lines of code. In this blog, we will learn how to use that library.
Installation
Install the SweetViz library-
pip install sweetviz
To perform EDA, we are going to use the dataset of Amazon bestselling books during the years 2009-2019 available in Kaggle
Import Pandas library to read the CSV dataset file downloaded from the Kaggle
import pandas as pd
import sweetviz as sv
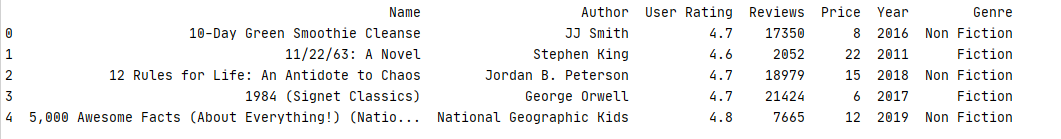
df = pd.read_csv("bestsellers_with_categories.csv")
The dataset will contain the data such as book name, author, user rating, reviews, price and Genre.
Create a report of the dataset
Import SweetViz and use its analyze() function to perform EDA on the dataset. After that, you can view the report as an HTML file in the browser.
eda_report = sv.analyze(df)
eda_report.show_html('sweet_report.html')
This report will contain information about the features present in the dataset and their details such as missing values, unique values. For the numerical data, it will show min, max, median, mode, average, standard deviation.
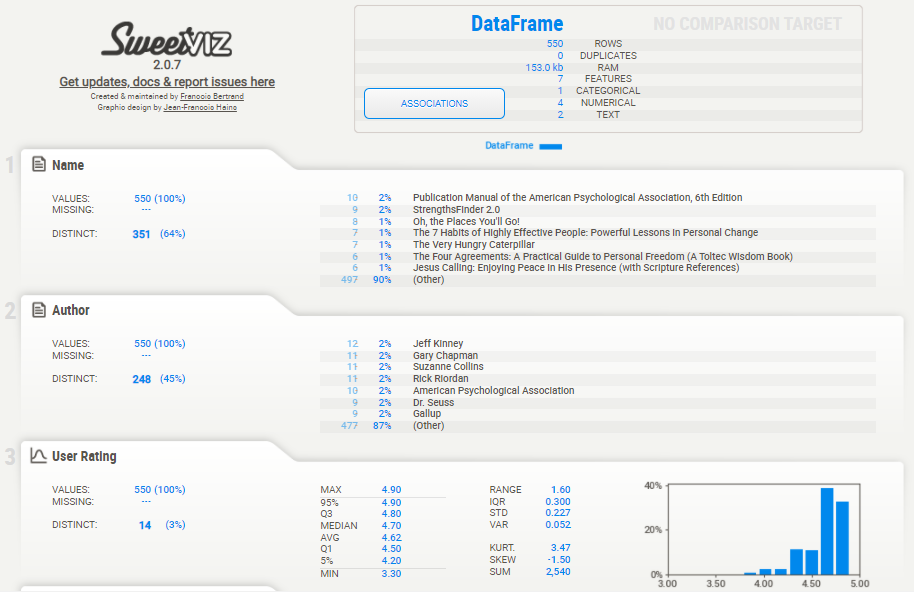
Using Sweetviz, we can also do the target analysis and its impact on other attributes.
Create a report by comparing two datasets:
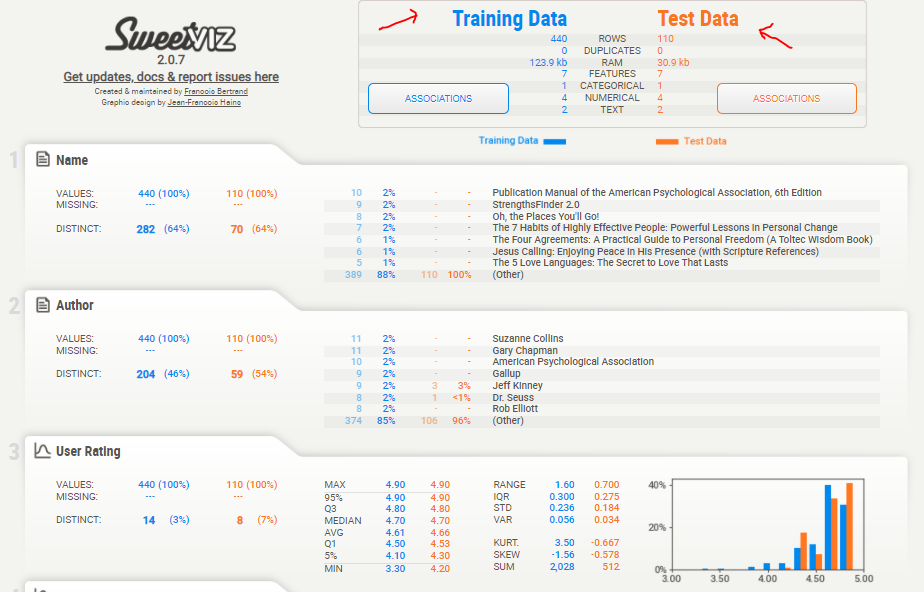
With the help of Sweetviz, You can compare the test and training datasets. Split the dataset into training_data and test_data.
training_data = df[0:440]
test_data = df[440:]
comparison_report = sv.compare([training_data, "Training Data"],[test_data, "Test Data"])
comparison_report.show_html('Compare Reports.html')
In the report, we can see the analysis and comparison of all attributes in the test and training dataset.
Create a report for two different subsets of a dataset
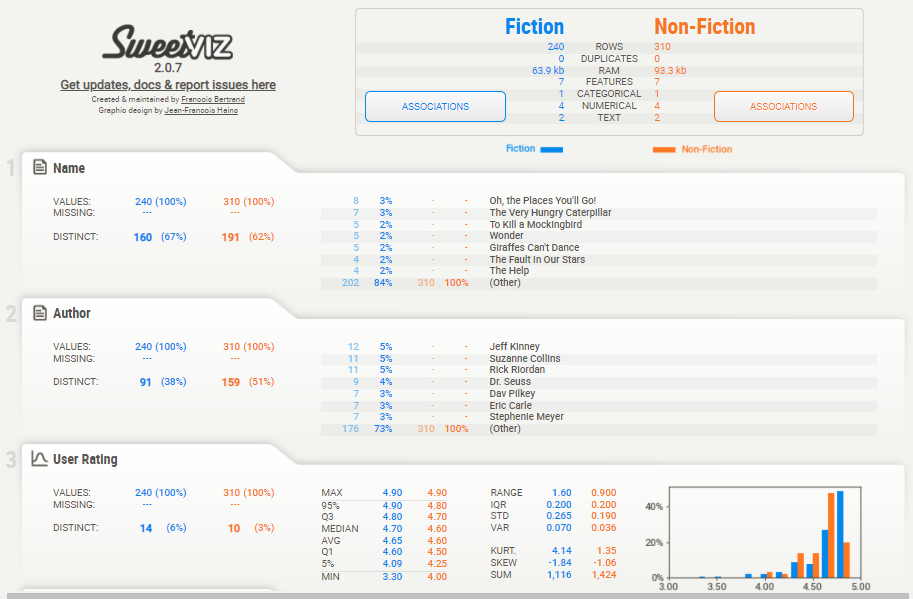
Now, Divide the dataset into two subsets based on the Genre column such as one subset will contain the data of fiction books and the other will contain non-fiction books. Then compare and analyze these two different subsets.
category_report = sv.compare_intra(df, df["Genre"] == "Fiction", ["Fiction", "Non-Fiction"])
category_report.show_html('Genre_Report.html')
Look into the comparison report below
Using Sweetviz in a Notebook
In Jupyter and Google Colab, You can view the report directly inside the notebook instead of an HTML file. This can be done by using the method sweetviz.show_notebook()
Summing up, SweetViz is an interesting library to perform EDA in just fewer lines of code. It is still evolving and thanks to its maintainers and contributors


