Exploratory Data Analysis using Pandas Profiling

Software developer | Freelance Content Creator
Hello Coders!
Recently I came across another useful library called Pandas Profiling for doing exploratory data analysis in a couple of lines of code.
Pandas Profiling uses pandas data frame as an input and performs a quick analysis of the dataset. It then shares a report with a brief summary of the dataset along with visualizations. In the generated report, You can find the types of columns, unique values, missing values, and the most frequent values. It also displays duplicate rows and highly correlated values.
It is something similar to the SweetViz library which I have already shared in this blog. If you haven’t read the blog post yet, you can read it in the link.
Now, I will show you an example of how to use the library to generate reports.
Installation
Install the latest version of the library
pip install pandas_profiling
At the time of writing this blog, the latest version of pandas profiling library is v3.0.0
Prepare a report
To perform EDA, I have downloaded the dataset of Amazon Bestselling books 2009 - 2019 from Kaggle.
import pandas as pd
import pandas_profiling as pp

df = pd.read_csv("/content/bestsellers_with_categories.csv")

profile = pp.ProfileReport(df)
profile.to_file("output.html")
I will walk you through the above code now.
Import the necessary packages - Pandas and Pandas-Profiling.
Read the downloaded CSV file and create a data frame.
Input this data frame to the
ProfileReport() method.
It will analyze the dataset and produce a report containing the insights.
Then load the results to the file “Output.html”. Let us have a quick look into the generated report
Overview
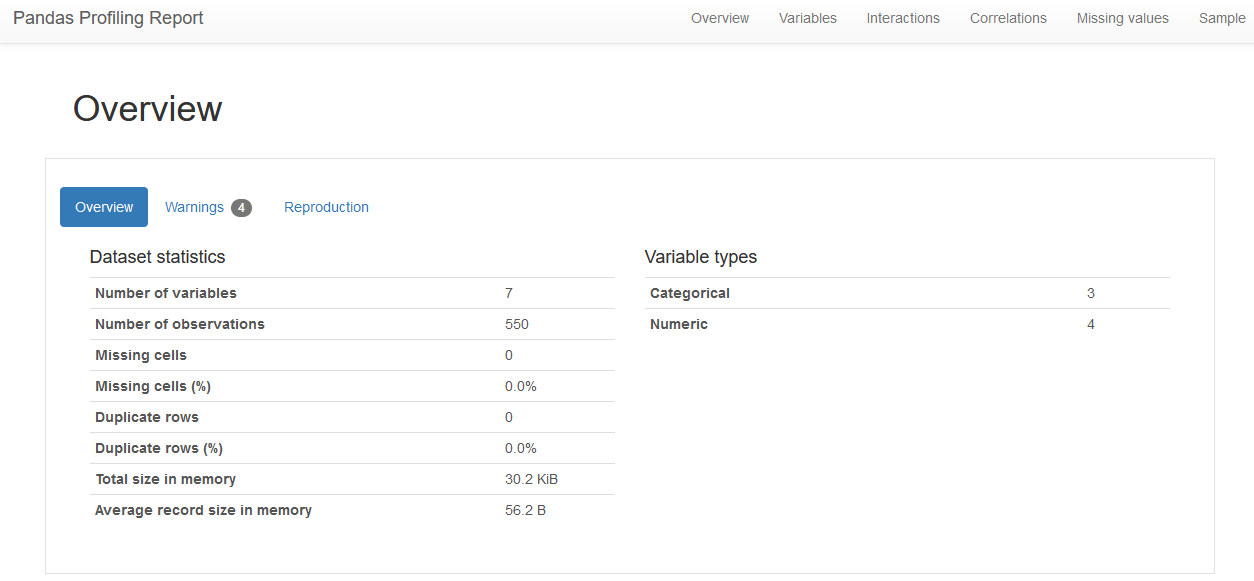
Here we can see an overview of the dataset such as the number of variables and a total number of records available in the dataset. Also, we can find the number of categorical and numerical variables, the number of missing cells, and the duplicate rows.
In this Amazon Bestselling books dataset, we can see that there are seven variables and 550 rows.
Sample Records
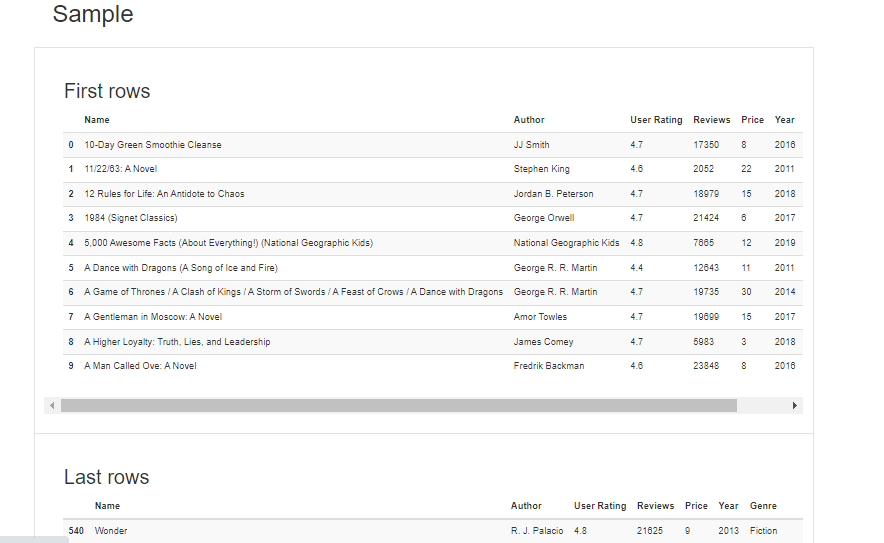
Scroll down to the bottom of the report, you can see the sample's first 10 records and the last 10 records of the dataset.
Variables
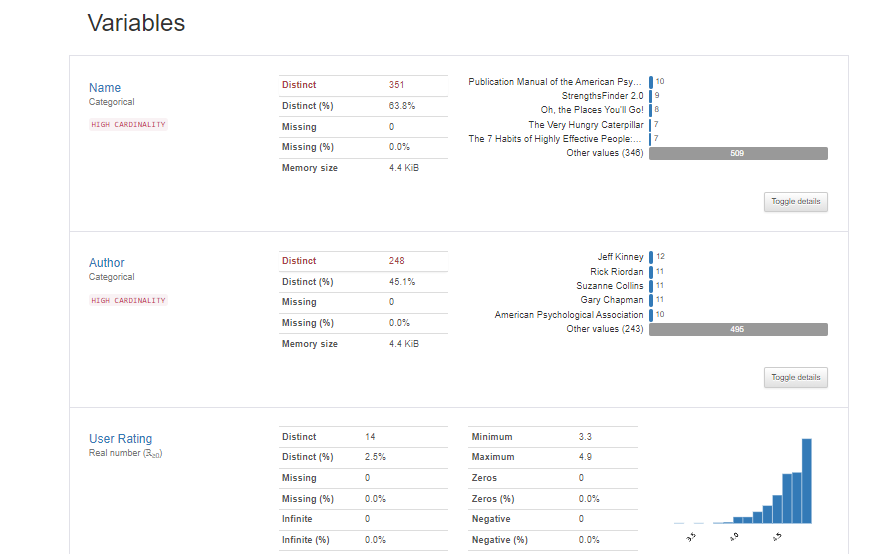
Next, we will have detailed information about each and every variable along with a histogram.
For the imported dataset, we can see that there are 351 unique book names which contribute to 63.8% of the dataset. And there are no missing values in the name column
Interactions
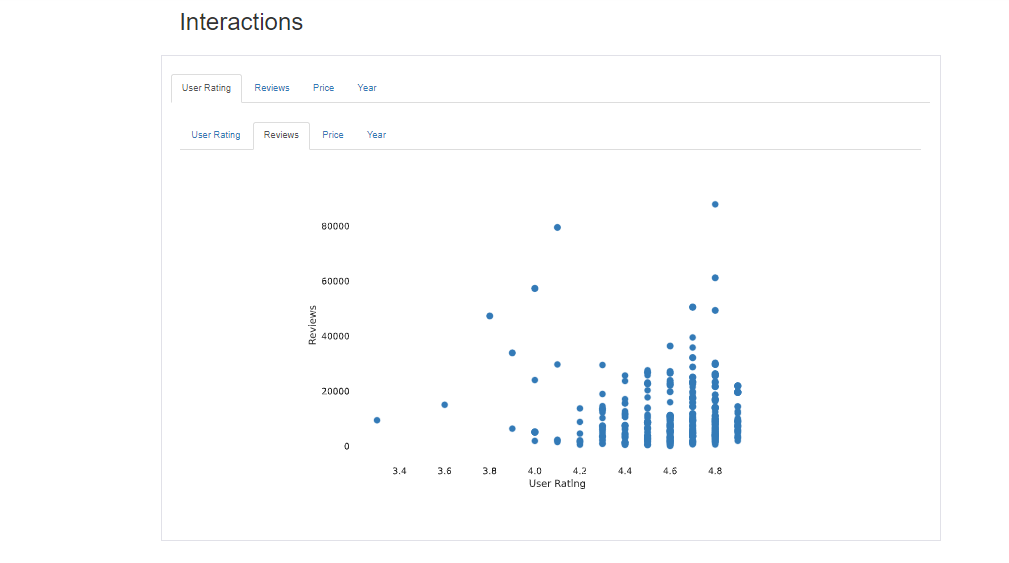
Pandas-Profiling automatically generates the interaction plots of every pair of variables. In the above diagram, we can see the interaction plot of the ‘User Ratings“ and “Reviews” columns.
Correlation:
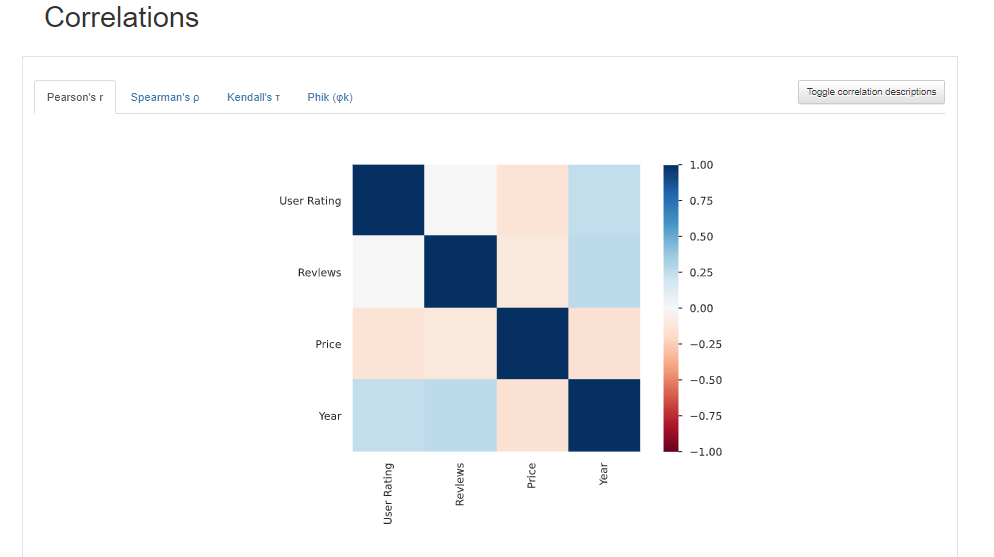
Correlation is another important feature generated in the report used to check how every two variables are related.
Missing Values:
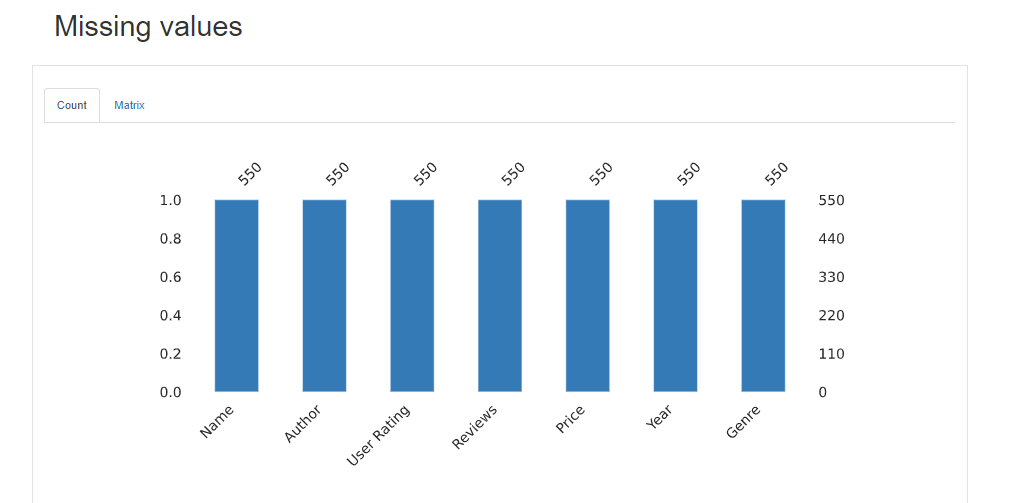
Using this, we can check the number of missing values in each variable. Here all the variables have 550 records so no missing values in this dataset.
You can find the code and a sample report in my github repository.
References:
Pandas Profiling Official documentation
https://pandas-profiling.github.io/pandas-profiling/docs/master/Cover Image Credits - Pandas profiling documentation


